
In the Northern Hemisphere at least, the idealised vision of Christmas involves snow. Whilst no one snowflake is exactly the same as another, at least on a molecular level, scientists have none-the-less devised a system of classification for the many types of crystals that snow can form. This graphic shows the shapes and names of some of the groups of this classification.
You might wonder what the shapes of snowflakes have to do with chemistry. Actually, the study of crystal structures of solids has its own discipline, crystallography, which allows us to determine the arrangement of atoms in these solids. Crystallography works by passing X-rays through the sample, which are then diffracted as they pass through by the atoms contained therein. Analysis of the diffraction pattern allows the structure of the solid to be discerned; this technique was used by Rosalind Franklin to photograph the double helix arrangement of DNA prior to Watson & Crick’s confirmation of its structure.
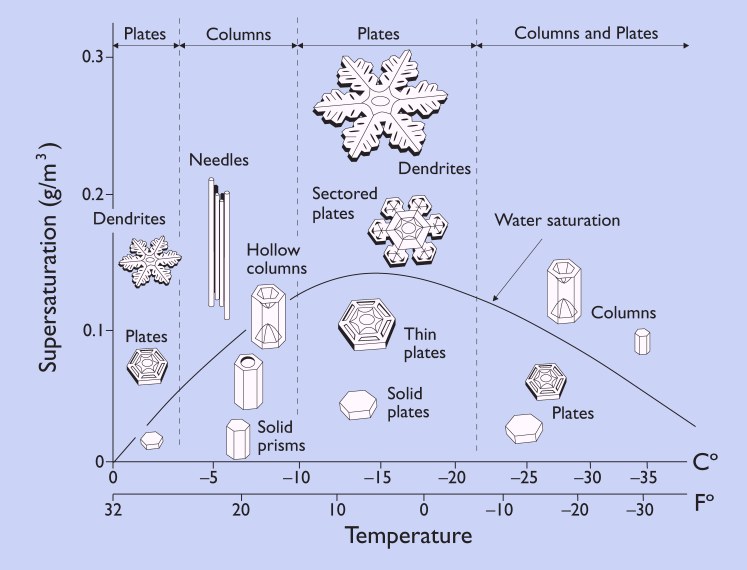
Back to snow crystals: the shapes they form are very dependent on temperature and humidity. This diagram illustrates this fact: simpler shapes are more common at low humidities, whilst more complex varieties of crystal are formed at high humidities. We still don’t know the precise variables behind the formation of particular shapes, although researchers are continually working on theoretical equations to predict snowflake shapes.
The number of categories snow crystals can be categorised into has been steadily increasing over the years. In early studies in the 1930s, they were classified into 21 different shape-based categories; in the 1950s, this was expanded into 42 categories, in the 1960s to 80 categories, and most recently in 2013 to a staggering 121 categories.
This latest study splits the classification into three sub-levels: general, intermediate, and elementary. The graphic featured here shows the 39 intermediate categories, which themselves can be grouped into 8 general categorisations. Each of the intermediate categories have specific characteristics, which are detailed at length in the research paper this graphic is based on.
The eight intermediate categories shown in the graphic are:
- Column crystals.
- Plane crystals.
- Combination of column & plane crystals.
- Aggregation of snow crystals.
- Rimed snow crystals.
- Germs of ice crystals.
- Irregular snow particles.
- Other solid precipitation.
There’s a lot more out there on snowflake structure than described here; if you want to read in much more detail, check out some of the links below. If you’d rather just see some amazing macro images of snowflakes, then check out the photos of Russian photographer Alexey Kljatov.


The graphic is also available to purchase on the Redbubble site here..
The graphic in this article is licensed under a Creative Commons Attribution-NonCommercial-NoDerivatives 4.0 International License. See the site’s content usage guidelines.
References & Further Reading
- A global classification of snow crystals – K Kikuchi & others
- A snowflake primer – K G Libbrecht
- The physics of snow crystals – K G Libbrecht


46 Comments
NikFromNYC
Antifreeze proteins include the usual blobby body but on one side suddenly appears a full flat plane of regularly spaced ice crystal matching hydrogen bonding stickiness:
http://proteopedia.org/wiki/index.php/1ezg
…or just full lines of regularity to match ice crystals:
http://proteopedia.org/wiki/index.php/3p4g
-=NikFromNYC=-, Ph.D. in chemistry (Columbia/Harvard)
P.S. How does the exact same snowflake crystal forms appear on all six arms at once? What causes that?! It’s quite odd, down to the very fractals of each arm being the same. You didn’t explain that.
Comments are closed.